
Deploying Claude effectively can save costs, improve speed, and enhance task accuracy. Here’s what you need to know:
- Key Metrics: Track latency, throughput, quality (e.g., F1 scores), and cost per token. For instance, fine-tuning Claude 3 Haiku improved F1 scores by 24.6%.
- Deployment Options: Choose between direct API, Amazon Bedrock, or hybrid setups to balance control and scalability.
- Architecture Tips: Use horizontal scaling, connection pooling, and region-specific deployments to reduce latency and handle traffic spikes.
- Prompt Optimization: Keep prompts concise, use structured formats, and minimize context size to reduce token usage and latency.
- Monitoring: Implement dashboards, real-time diagnostics, and A/B tests to track and improve performance.
Fine-tuning Claude requires continuous adjustments, from infrastructure to prompts, to meet business goals effectively. Start by aligning your deployment with user needs and measurable KPIs.
Key Performance Metrics to Track
Claude Performance Metrics: Latency, Throughput, Quality, and Cost Benchmarks
Core Metrics for Performance Evaluation
To enhance performance and manage costs effectively, focus on four key metrics.
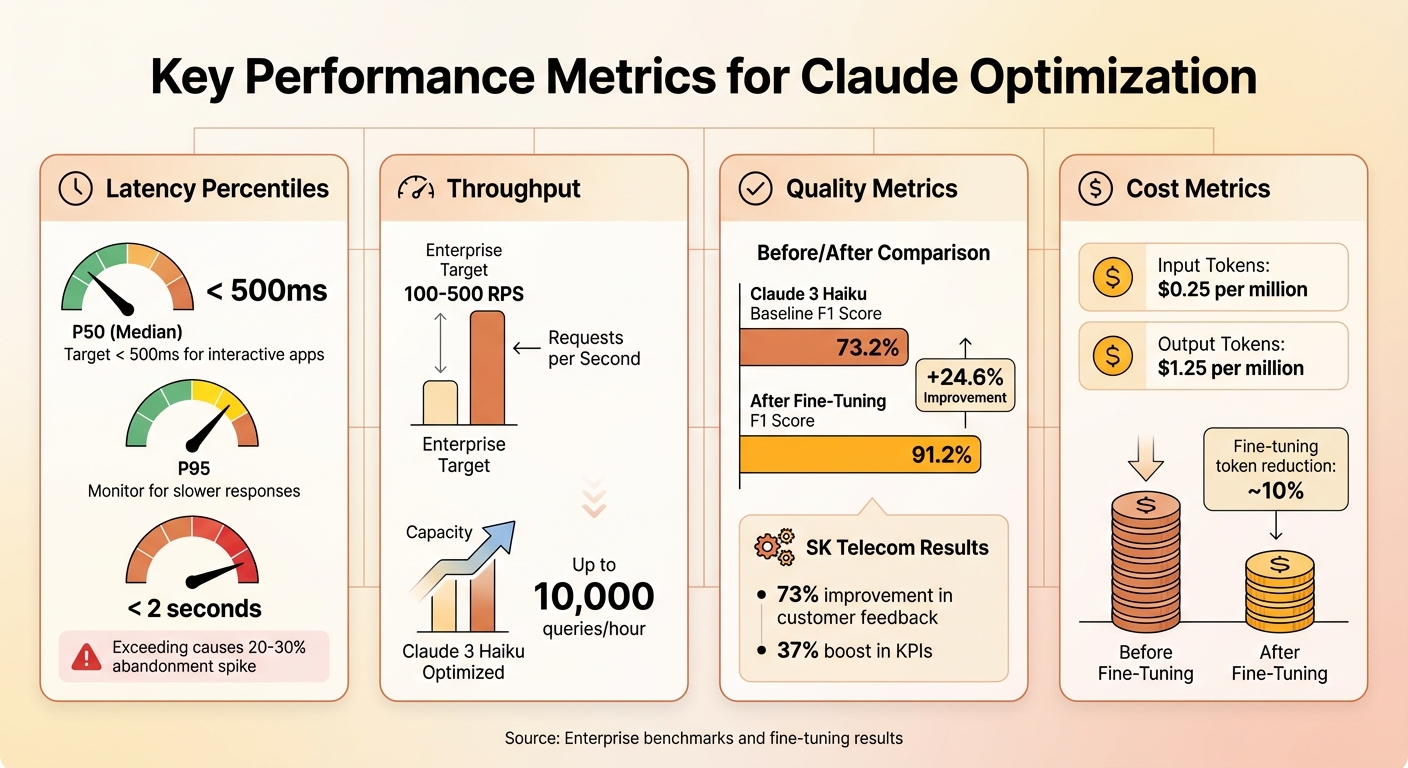
Latency percentiles reveal how fast your system responds. P50 represents the median response time, while P95 and P99 highlight slower, outlier latencies that can frustrate users. For interactive applications, aim for a P50 under 500 milliseconds. If P99 latency exceeds 2 seconds, you could see abandonment rates spike by 20-30% in real-time enterprise applications.
Throughput gauges your system’s capacity, typically measured in requests per second (RPS) or tokens per second. Enterprise systems often target 100-500 RPS, but with optimization, tools like Claude 3 Haiku can handle up to 10,000 queries per hour. Higher throughput directly impacts revenue by enabling more transactions without scaling infrastructure.
Quality metrics assess task accuracy. For example, fine-tuning boosted Claude 3 Haiku’s F1 score from 73.2% to 91.2%, while SK Telecom reported a 73% improvement in customer feedback and a 37% boost in key performance indicators (KPIs). These metrics link technical improvements to tangible business outcomes, such as fewer errors and happier customers.
Cost metrics are equally critical. Keep an eye on costs per 1,000 tokens – $0.25 per million input tokens and $1.25 per million output tokens. Fine-tuning can reduce token usage by around 10%. Translate these costs into per-task or per-query figures to help stakeholders weigh ROI against budget limitations.
Monitoring and Governance
Once you’ve established these metrics, continuous monitoring is essential to maintain performance. Tools like Datadog and New Relic can provide real-time tracking for latency, throughput, and token usage. For more tailored insights, integrate with Amazon Bedrock logs to create Claude-specific dashboards. These dashboards can trigger alerts if metrics deviate, such as P95 latency exceeding 1 second. Use your initial benchmarks – like the 73.2% F1 score before tuning – as a baseline to measure the impact of updates.
Strong governance ensures performance stays consistent as you scale. Implement role-based access controls (RBAC) in your monitoring tools to limit who can view or modify sensitive metrics. When rolling out updates, rely on A/B testing to compare fine-tuned versions against base models using datasets like TAT-QA. Canary deployments are another safeguard, allowing you to test changes on a small portion of traffic before a full rollout. This minimizes the risk of widespread performance issues.
Architecture Strategies for Scaling Performance
Once you’ve established key metrics and governance strategies, the next step is optimizing architecture to scale Claude effectively and efficiently.
Deployment Patterns for Claude

You can deploy Anthropic‘s Claude using three main approaches: direct API integration, platform-based deployments like Amazon Bedrock, or a hybrid setup that blends both methods.
- Direct API integration: This option provides full control over prompts with minimal latency, making it perfect for real-time chatbots handling smaller tasks (under 10,000 tokens). You’ll also benefit from immediate access to updates. However, you’ll need to manage scaling, monitoring, and infrastructure yourself.
- Amazon Bedrock: Bedrock simplifies things by offering managed infrastructure for fine-tuning Claude 3 Haiku. It automatically handles serverless scaling, integrates seamlessly with AWS security tools, and supports VPC PrivateLink for sensitive workloads. Keep in mind, though, that this approach might involve vendor lock-in and slightly higher latency. Aligning your deployment method with your monitoring practices ensures a cohesive performance strategy.
- Hybrid architectures: This approach splits tasks based on complexity. For example, lightweight tasks like basic classification can go through the direct API, while more complex queries (like those involving the TAT-QA dataset) can be routed to fine-tuned Bedrock-hosted models. This balance helps optimize cost, performance, and flexibility.
Scaling and Infrastructure Optimization
When it comes to handling increased traffic, horizontal scaling is often more effective than vertical scaling. By adding API instances behind a load balancer, you can manage traffic spikes more efficiently. Distributing requests across multiple AWS regions can also cut latency by 20–50%. For West Coast businesses, deploying in the us-west-2 region often achieves a P95 latency of under 100ms.
Connection pooling can further improve performance by maintaining reusable HTTP/2 connections to Claude endpoints. This reduces handshake overhead by up to 200ms per request, which is especially useful when handling thousands of requests per second. Additionally, selecting AWS regions close to your users or backend systems minimizes round-trip time.
For larger tasks – those exceeding 100,000 tokens or involving multi-step workflows – an asynchronous setup works best. By using message queues like AWS SQS, you can decouple task submission from processing. Background workers can handle these long-running tasks without interrupting user flows, cutting perceived latency by up to 60%. Auto-scaling groups can also be configured to activate based on queue depth, ensuring you only pay for compute resources when they’re needed.
Workload Routing and Model Selection
Routing tasks to the right Claude model based on complexity is key to optimizing performance.
- Claude 3 Haiku: This model is ideal for lightweight tasks such as classification, simple Q&A, and summaries. It delivers inference speeds 2–5× faster than larger models.
- Claude 3.5 Sonnet or Opus: These models are better suited for tasks requiring complex reasoning, multi-step planning, or high accuracy.
In some cases, a fine-tuned Claude 3 Haiku deployed on Bedrock can outperform larger models for specialized tasks, as benchmarks have shown. Dynamic routing – using metadata like token count, task type, or keywords – can ensure tasks are sent to the most cost-effective model without compromising quality. A dedicated router that logs these decisions helps refine performance over time.
To maintain reliability, fallback strategies are essential. For instance, if Claude 3.5 Sonnet times out, you can retry with Haiku or return a cached response. Another effective method is multi-model ensembles, where Haiku generates drafts and Sonnet refines them. This approach has been shown to improve accuracy by 9.9% compared to using a single model. Monitoring error rates and adjusting routing thresholds based on actual performance data further enhances system dependability.
These architectural strategies set the stage for effective prompt optimization and workload management, which will be explored in the next section.
Optimizing Prompts, Context, and Workloads
Once you’ve set up effective architecture patterns, refining how you handle prompts and workloads can take Claude’s efficiency to the next level.
Best Practices for Prompt Design
Crafting concise and well-structured prompts is key to minimizing token usage and reducing latency. Start with clear task instructions, then include examples in formats like JSON or XML. For instance, instead of lengthy descriptions, use something like: "Respond only in JSON: {‘summary’: ‘…’, ‘key_points’: []}".
Cutting down on verbosity can reduce token usage by as much as 15–50%, directly lowering costs and speeding up processing. However, don’t go too far – overly sparse prompts can hurt output quality. Adding system prompts that define roles, such as "You are a precise analyst," can enhance classification task performance, improving F1 scores by 10–24%. Explicit instructions like "think step-by-step" help maintain accuracy while keeping prompts streamlined.
Managing Context Windows
Claude can handle an impressive 200,000-token context window, which supports complex reasoning tasks. However, larger contexts can increase latency by 2–5× and drive up costs due to quadratic attention scaling. For simpler tasks, keeping contexts under 10,000 tokens can cut latency and costs by 50–80%.
Breaking documents into smaller chunks – 1,000 to 4,000 tokens with a 20% overlap – can further reduce latency and costs. Summarize each chunk before passing it to Claude. For even greater efficiency, consider retrieval-augmented generation (RAG). This method uses vector search to retrieve the top 3–5 most relevant chunks, shrinking the overall context size by 70–90%. As a result, latency drops by 40–60%, and accuracy improves because Claude focuses only on the most relevant information.
Caching and Reuse Strategies
Caching repeated prompts is one of the easiest ways to boost efficiency. Using platform-level caching, such as Amazon Bedrock, stores repeated prefixes automatically. This can cut latency by 50–75% and reduce costs by up to 75% for cache hits. Alternatively, tools like Redis can cache entire prompt-response pairs, indexed by hash.
In production settings where workloads are repetitive, caching the first 80% of a prompt (the shared prefix) prevents reprocessing. This approach can slash latency from 2 seconds to just 0.5 seconds – a 75% reduction. It’s particularly effective when system instructions or user query patterns remain consistent across sessions. The trick is identifying which parts of your prompts are reusable and structuring them to maximize cache efficiency.
| Prompt Optimization Technique | Latency Reduction | Cost Savings |
|---|---|---|
| Structured JSON/XML formats | 20–30% | Token-efficient |
| Prompt caching (repeated prefixes) | Up to 75% | Up to 75% |
| RAG for context injection | 40–60% | Proportional to reduced tokens |
| Concise phrasing | 10–25% | Direct token reduction |
sbb-itb-f73ecc6
Performance Monitoring and Continuous Improvement
Post-deployment tuning is an ongoing process of measuring, testing, and refining your system to ensure optimal performance.
Designing Effective Benchmarks
Benchmarks should closely replicate real-world production scenarios. This means simulating actual user interactions such as summarization tasks, support workflows, coding assistance, or analytics queries. Use the same prompt templates, context window sizes, and concurrency levels that your system handles in production.
Start by establishing clear baselines for both quality and system performance. Track key metrics like accuracy, F1 scores, user satisfaction ratings, latency, and cost per request. When testing new configurations, change only one variable at a time – whether it’s the model version, temperature setting, or prompt structure. This way, you can clearly identify which adjustments lead to improvements. For more complex tasks, where automated metrics may not fully capture performance, combine these evaluations with human reviews. You can even use a stronger Claude model to scale assessments, while still conducting human spot-checks to catch bias or errors.
Finally, implement real-time diagnostics to quickly identify and address issues as they arise.
Real-Time Monitoring and Diagnostics
Monitoring your system in real time is critical for catching issues before they affect users. For every interaction with Claude, log important details like timestamps, model name, input and output token counts, latency, HTTP status codes, and estimated costs. Use this data to build dashboards that track key metrics such as p50, p90, and p99 latency, error rates (e.g., timeouts, 4xx configuration issues, 5xx provider failures), token usage patterns, and concurrent request volumes.
When you encounter bottlenecks, break down latency into its components – client-side, network, API, and system delays – to pinpoint the source of the problem. If prompts are becoming too lengthy, consider trimming or summarizing inputs to maintain focus. If error rates suddenly spike after a change, roll back immediately and compare the current logs with your baseline. Often, latency surges are tied to unexpected increases in context length or slow external dependencies.
Iterative Tuning and Safe Rollouts
With detailed benchmarks and real-time diagnostics in place, iterative tuning becomes a powerful tool for refining performance. Start by defining your objective, adjust a single variable, test offline, and then deploy the change to a small fraction of traffic – typically 1–5%. Monitor performance carefully before deciding to scale or roll back.
For safer rollouts, use canary deployments (1–5% of traffic) or A/B tests to compare the new setup against your current configuration. Evaluate quality, latency, and cost metrics before a full rollout. For more critical updates, compare a control group using the current setup with a treatment group experiencing the new model or prompt. Beyond technical metrics, track user-facing KPIs like customer satisfaction and resolution rates. For example, fine-tuning Claude 3 Haiku led to a 24.6% improvement in F1 scores and outperformed the Claude 3.5 Sonnet base model by 9.9% on the same benchmark.
Make it a habit to review performance on a monthly basis. Adjust prompt templates, model routing, and tuning parameters as needed. Set up automatic rollback triggers for situations where error rates, latency, or safety flags exceed predefined thresholds. For high-risk changes, require manual approval to ensure careful oversight. By sticking to this disciplined approach, performance tuning becomes a sustainable practice that keeps your system aligned with service level agreements and budget goals.
Conclusion
Refining Claude is an ongoing journey that blends smart system design, thoughtful prompt crafting, and constant performance evaluation. The strategies outlined here provide a solid framework: focus on tracking meaningful metrics, implement scalable infrastructure to manage workloads efficiently, fine-tune your prompts and context windows, and embrace continuous improvement through benchmarks and controlled rollouts. For instance, the fine-tuned Claude 3 Haiku demonstrated a 24.6% boost in F1 scores compared to baseline models and outperformed Claude 3.5 Sonnet by 9.9% on domain-specific tasks. Similarly, SK Telecom achieved a 73% rise in positive feedback and a 37% enhancement in key performance indicators after integrating a fine-tuned Claude model into their customer support workflows. These achievements highlight the value of high-quality data, disciplined tuning, and reliable monitoring – proving that success doesn’t solely depend on using larger models.
Start by aligning your goals with clear business objectives and measurable key performance indicators. Design your infrastructure to scale intelligently: route simpler tasks to efficient models like Haiku while reserving more complex reasoning for advanced variants. Focus on optimizing prompts with structured formats and clear instructions, manage context windows to cut costs and reduce latency, and use caching for repetitive queries. Above all, measure everything – latency, error rates, token usage, and task success rates – and let the data guide your iterations.
Claude excels in advanced language understanding, deep reasoning, and tackling real-world tasks, making it a strong choice for enterprise-scale operations. Whether it’s customer support, coding, data analysis, or knowledge work, Claude’s flexibility through fine-tuning and prompt engineering allows you to hit demanding performance and cost goals. Treat your Claude deployments as you would any critical service – ensure strong governance, proactive monitoring, and safe rollouts. By combining meaningful metrics, scalable systems, and efficient prompts, you can keep your Claude deployment both effective and adaptable.
FAQs
What are the best ways to monitor and enhance Claude’s performance?
To keep Claude running smoothly and efficiently, pay attention to critical metrics like response accuracy, latency, and resource usage. Anthropic offers built-in tools such as dashboards and logging systems that make it easier to track performance trends and pinpoint areas that need attention.
Improving performance means finding the right balance in workloads and tweaking resource allocation based on the data you collect. Regular reviews and adjustments are key to resolving any bottlenecks that may arise. By continuously monitoring these aspects, you not only maintain technical efficiency but also ensure that ethical standards remain intact, helping Claude deliver its best results.
How can I optimize prompts to improve response speed and reduce costs?
To get faster responses and save on costs, aim for clear and concise prompts. Skip the overly complex language or vague phrasing, and stick to specific, straightforward instructions. This makes it easier for the model to process your request quickly and accurately, avoiding unnecessary use of resources.
You can also improve efficiency by customizing prompts to match the specific task and cutting out any irrelevant information. This keeps the process focused and cost-effective.
What’s the best way to deploy Claude: direct API, Amazon Bedrock, or a hybrid approach?
When choosing a deployment method, it’s all about matching the approach to your specific needs:
- Direct API integration works well if you’re looking for a simple setup with more control over how you customize the solution.
- Amazon Bedrock provides a managed, scalable platform, making it a solid choice for large-scale operations where infrastructure management needs to be kept minimal.
- A hybrid setup blends the adaptability of APIs with the scalability of Bedrock, offering a balanced solution for handling performance and varying workload demands.
Take a close look at your workload size, how much scalability you need, and the technical resources you have available to pick the approach that fits your objectives.